Mining Iron Ore in WA
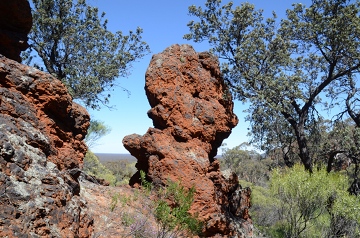
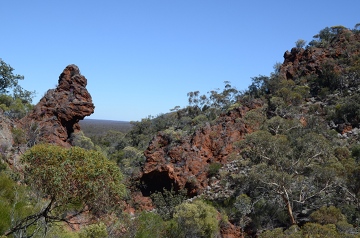
Most of the iron ore mining in Western Australia occurs on two significant landforms. These are known as banded ironstone formation (BIF) and channel iron deposit (CID). The BIFs occur on the ranges and ridges of the Yilgarn Craron (including Helena and Aurora Range) and Pilbara Craton. The CIDs are the mesas (flat topped hills) in the Pilbara.
Mining for iron ore in the Hammersley Ranges started in the 1960s (as did iron ore mining in the Yilgarn at Koolyanobbing). Iron ore in the Hammersley Ranges (Pilbara) was discovered by Lang Hancock. His daughter Gina Rinehart and family company Hancock Prospecting Pty Ltd continue to have interests in this area. Currently the major mining companies with iron ore mines in the Pilbara include Rio Tinto Limited, BHP Billiton and Fortescue Metals Group.
In the Midwest (also referred to as the Goldfields) there were four mines operating on BIF ranges in the Midwest in 2010-2011. These were at Koolanooka, Tallering Peak, Jack Hills and Karara Blue Hills Gindalbie. Within the Northern Yilgarn there were mining projects operating at Koolyanobbing and Carina. There are also mining iron ore projects in the Kimberley and one in the Wheathbelt.
The iron ore mined and shipped from Western Australia has been haemetite ore, also referred to as Direct Shipped Ore. Magnetite ore, also present as a resource in Western Australia, can also be used by Chinese steel producers. Some magnetite projects are currently being developed in the Midwest of Western Australia such as at Mt Karara (Government of Western Autralia, 2008), known as the Karara Iron Ore Project. Magnetite requires some different technology to mine as it needs to undergo concentration to be suitable for export for use in steel production.
The price of iron ore has been one of the main driving forces for exploration and mining for iron ore in Western Australia.
Price of Iron Ore
The price of iron ore began to rise in 2002. Significant increases occurred from 2003 to 2004, 2006 to 2007 and 2008 to 2009. During 2010-2011 prices reached US$194 per tonne for lump and US$184 per tonne for fines (or US$187 per metric tonne for fines in February 2011. source: Index Mundi website). On average, Western Australian producers received US$156 per tonne for lump and US$135 per tonne for fines during 2010-2011. The actual agreed to prices for each mining company can vary. More recently, the price for iron ore fell in October and November 2011 and then again during May, June and July 2012 to US$127.94 per metric tonne for fines (source: Index Mundi website).
Statistics on exports of iron ore and expenditure on exploration in Western Australia provide a reasonable representation of the increases in mining activity that have occurred in Western Australia (and Australia) over the last eight years. A summary of trends observed to date is given below.
For more information on iron ore prices and exports of iron ore see the Department of Minerals and Petroleum (DMP) digest: Western Australian and Western Australian Mineral and Petroleum Statistics Digest, avaialble to view on the DMP website or avaialble free as a booklet from their offices at Mineral House in Perth. For more information on exploration activity see Geoscience Australia: Australian Mineral Exploration Review publication list; http://www.ga.gov.au/cedda/publications/1200.
Sources:
Department of Mines and Pertroleum (2011) Western Australian Mineral and Petroleum Statistics Digest 2010-11. Index Mundi website
Exports from Western Australia
For the financial year, 2010-2011, the two iron ore producers Rio Tinto Limited and BHP Billiton apparently accounted for approximately 87% of Western Australia's iron ore production.
The total tonnage of iron ore exported from Western Australia in 2010-2011 was 396 million tonnes. The total export tonnage for Australia was just over 400 million tonnes.
China imported just over a total of 550 million tonnes of iron ore in 2010. Western Australia primarily exports iron ore to China. A total of 68% or iron ore exports went to China in 2010-2011. Iron ore was also exported to Japan (18%), South Korea (11%) and Taiwan (3%).
Iron ore exports began to rise in Western Australia in 1966 to reach around 100 million tonnes per annum for the period, 1974 to 1988. Exports began to rise again in 1989. By 2003 exports had reached 200 million tonnes and by 2008 had reached over 300 million tonnes per annum, to almost 400 million tonnes in 2010.
Plans to increase iron ore production, with the establishment of new mines or the expansion of existing mines continue. For example in the Pilbara, Rio Tinto Limited was planning to increase its iron ore production schedule to 230 million tonnes per annum by first quarter of 2012, followed by a planned further expansion by the second half of 2013 and first half of 2015. Also, Fortesque Metals Group expanded its output to 55 million tonnes of iron ore in 2011 at Christmas Creek.
In the Midwest and Northern Yilgarn the export tonnage per financial year is considerably smaller. Karara Mining Limited is expected to export 2 million tonnes of iron ore in 2012 from Karara Mine. Mt Gibson Iron Ltd’s Extension Hill Project is expected to be around 3 million tonnes per annum. Kimberley Metals Group Pty Ltd plans to export 2.5 million tonnes per annum from its Ridges Project. Moly Mines Limited expects to produce 1 million tonnes per annum from Spinifex Ridge Molybdenum Project. New projects are currently being proposed and developed in the Midwest and Northern Yilgarn. The Karara Iron Ore Project, once developed aims to deliver 10 million tonnes per year of iron products, including a significant proportion of high grade magnetite concentrate.
Sources:
- Department of Mines and Pertroleum (2011) Western Australian Mineral and Petroleum Statistics Digest 2010-11.
- Government of Western Autralia (2008) Strategic Review of the Conservation and Resource Values of the Banded Iron Formation of the Yilgarn Craton.
Mineral Exploration in Western Australia
The amount of exploration activity or exploration expenditure can reflect the profitability of mineral prices for mining, as well as an indication of the potential increases in number of mines that may be proposed and developed in the near future. Some have described Western Australia as being in a mining boom over the last 10 years. The data presented below, on expenditure for exploration within Western Australia would certainly support this observation, particularly for the last six to seven years.
Geoscience Australia, an Australian Government Department (adjunct to Department of Resources, Energy and Tourism), produces annual Australian Mineral Exploration Reviews for Australia (years ending on 30th June). Trends can be observed from one financial year to the next. Beginning in the financial year 2000-2001, the data on total expenditure for Australia and proportion expended by Western Australia for mineral exploration has been presented below. Each report that has been referred to is listed below under References. Any interpretations of the data are purely our own.
In summary, within Western Australia there was a peak in expenditure in 2007-2008 where spending on mining exploration had more than tripled from a low of $381 million in 2001-2002 to a high of $1259.8 million in 2007-2008 (3.3 fold increase). For the whole of Australia, exploration expenditure effectively doubled from 2000-2001 to 2007-2008. The main increase in exploration activity in Western Australia appears to have started in 2005. The increasing expenditure on exploration continued until it plateaued in 2009 and 2010. An increase of 28% in spending then occurred during the year 2010-2011 to a record high of $1590 million. The percentage of exploration expenditure in Australia that occurred in Western Australia was high each year (close to 50%), ranging from 47.6% to 62.1%. Increases in expenditure on exploration also occurred in other states of Australia, however, they have not been listed here.
- 2000-2001
In Australia there was a small increase in spending on exploration of 1% to $683.3 million. Access to government generated geoscience data was improved during this year. 62.1% of mineral exploration expenditure in Australia was in Western Australia ($424.1 million) This appears to be the first increase in exploration spending since 1996-1997.
- 2001-2002
In Australia there was a decrease in spending on exploration, down by 6% to $640.6 million. This was the lowest since 1992-1993. 59% of mineral exploration expenditure in Australia was in Western Australia ($381 million)
- 2002 to 2008 (a period including six financial years)
In Australia, over the six financial years 2002-2003 to 2007-2008, there was an increase in expenidture on exploration each year, the greatest increases occurring over the latter four years, from 2004-2005 to 2007-2008 (31%, 20.6%, 38% and 41% increases respectively) to a final figure of $2461.4 miliion expenditure on exploration in 2007-2008. The financial year 2007-2008 experienced the highest percentage increase on record (41% increase). Base metals and gold were the main targets, spending also increased for iron ore, coal and uranium. The Western Australian Government provided $13.4 million over four years (from 2005-2006) towards the Geological Survey of Western Australia to stimulate exploration.
By 2007-2008, 51% of mineral exploration expenditure in Australia was in Western Australia ($1259.8 million)
- 2008-2009
In Australia there was a decrease in spending on exploration, down by 9.7% to $2223.1 million. Spending fell in all states except the Northern Territory, a result of the Global Financial Crisis. Expenditure predominantly fell for the base metals, gold and uranium. This was offset to some extent by an increase in exploration for iron ore, up by 30.9% in Western Australia.
56% of mineral exploration expenditure in Australia was in Western Australia ($1244.9 million)
The Western Australian Government initiated a five year funding program of an $80 million Exploration Incentive Scheme (EIS) to encourage exploration in Western Australia Included airborne magnetic surveys, 3D geological mapping and improved access to Aboriginal land for exploration.
- 2009-2010
In Australia there was a small Increase in spending on exploration, up by 9.4 million (0.4%) to $2232.5 million. The increase was mainly for gold.
56% of mineral exploration expenditure in Australia was in Western Australia ($1244.1 million).
Production not increased due in part to a longer wet season delaying operations in the Pilbara.
- 2010-2011
In Australia there was an increase in spending on exploration, up by 32% to $2951 million. There were increases in expenditure for most commodities (exceptions being for diamonds and mineral sands), with the highest expenditure being for iron ore then gold.
54% of mineral exploration expenditure in Australia was in Western Australia ($1590 million).
References
Geoscience Australia: Australian Mineral Exploration Review publication list; http://www.ga.gov.au/cedda/publications/1200
Huleatt MB, Jaques AL and Towner RR (2001) Australian Mineral Exploration. A review of exploration for the year 2000. (on line). Viewed 6 December 2011. Geoscience Australia.
Huleatt MB, Towner RR and Jaques AL (2002) Australian Mineral Exploration. A review of exploration for the year 2001. (on line). Viewed 6 December 2011. Geoscience Australia.
Huleatt MB, Jaques AL and Towner RR (2003) Australian Mineral Exploration. A review of exploration for the year 2002. (on line). Viewed 6 December 2011. Geoscience Australia.
Huleatt MB, Towner RR and Jaques AL (2004) Australian Mineral Exploration. A review of exploration for the year 2003. (on line). Viewed 6 December 2011.
Huleatt MB, Jaques AL, Ratajkoski M and Towner RR (2005) Australian Mineral Exploration. A review of exploration for the year 2004. (on line). Viewed 6 December 2011. Geoscience Australia.
Huleatt MB, Jaques AL and Ratajkoski M (2006) Australian Mineral Exploration. A review of exploration for the year 2005. (on line). Viewed 6 December 2011. Geoscience Australia.
Huleatt MB, Worden KE and Jaques AL (2007) Australian Mineral Exploration. A review of exploration for the year 2006. (on line). Viewed 6 December 2011. Geoscience Australia.
Huleatt MB and Jaques AL (2008) Australian Mineral Exploration. A review of exploration for the year 2007. (on line). Viewed 6 December 2011. Geoscience Australia.
Huleatt MB and Jaques AL (2009) Australian Mineral Exploration. A review of exploration for the year 2008. (on line). Viewed 6 December 2011. Geoscience Australia.
Huleatt MB (2010) Australian Mineral Exploration. A review of exploration for the year 2009. (on line). Viewed 6 December 2011. Geoscience Australia.
Huleatt MB (2011) Australian Mineral Exploration. A review of exploration for the year 2010. (on line). Viewed 6 December 2011. Geoscience Australia.
Senior AB and Huleatt MB (2012) Australian Mineral Exploration. A review of exploration for the year 2011. (on line). Viewed 2 April 2012. Geoscience Australia.
SOURCE:
 © Commonwealth of Australia (Geoscience Australia) 2012
This material is released under the Creative Commons Attribution 3.0 Australia Licence.